The US economy has experienced consistent growth over the past decade, marking the country’s longest period of continued economic expansion in history. In recent Congress testimony, the Chairman of Federal Reserve further agreed that the US economy is far from recession. However, he also noted that recent economic events across the border may negatively impact future growth and added that the central bank will “act as appropriate” to sustain expansion as “crosscurrents” weigh on their economic outlook.
Slowing of strong economic expansion does not mean recession
What changed the Fed’s attitude? In addition to political turbulence between the White House and the Fed, prolonged global trade tensions have triggered concerns from the private sector.
As stated in his testimony to Congress, the Chairman of the Federal Reserve noted that business investment has slowed with little sign of recovery. Declining housing investment and manufacturing output combine with underwhelming CPI figures to create a dovish Fed attitude.
In our view, the potential for rate cuts are uncorrelated to the possibility of recession. This round of monetary easing is preventative in nature and intended to marginalize the risk of economic downturn.
The latest round of rate cuts was triggered by limited market liquidity. To combat the dramatic fall in asset prices, central banks were compelled to introduce unprecedented easing into the financial system. These actions were intended to mitigate the consequences of limited market liquidity rather than solve the issue itself.
All periods of expansion go through cycles of growth and slowing. We will highlight defining metrics for the US economy and share our views on the probable impact of quantitative easing on asset prices, below.
It is important to understand that even with a strong indication of rate cuts, it is unlikely that the Fed will dramatically cut rates. There have been 4 cycles of rate cuts in US history since 1983. In the graph below, the Fed Fund Rate was in a relatively high range at each instance of rate cuts and the difference between peak and trough for each cut was large. In contrast, current Fed Fund Rate levels are significantly lower, hovering between 2.25-2.50%, providing little room for significant cuts.
Federal Fund Rate (Upper Band) (%)
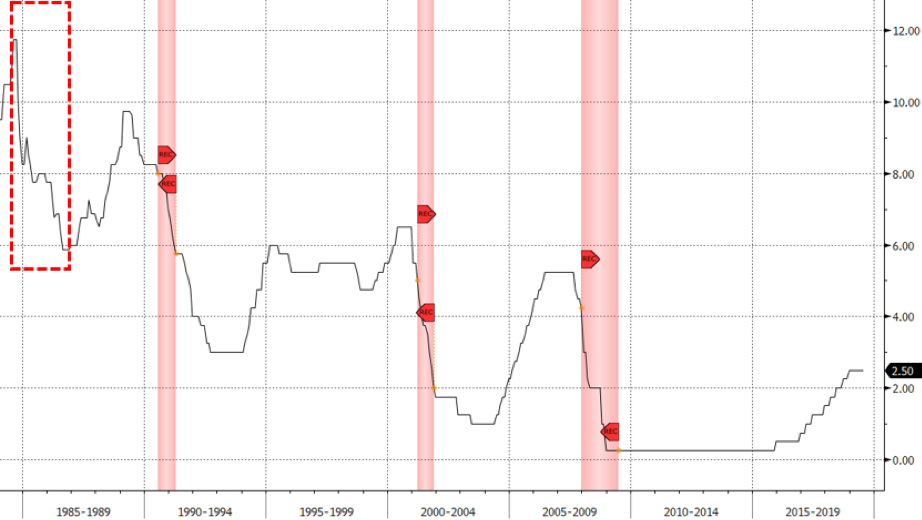
Source: Bloomberg
The US Labor Market remains healthy
We noticed that the latest ISM manufacturing PMI and Markit manufacturing PMI figures point to a slowdown in economic activity; inflation, contrastingly, remains below the Fed’s long-term target of 2%. Market uncertainties like Brexit, the trade war, etc. also elevate market volatility.
However, June’s solid employment report far exceeded market expectations. A 224,000 gain in non-farm payrolls for June was stronger than expected, with the three-month average gain now standing at a solid 171,000. While slower than the previous pace of over 200,000, it still remains above the threshold for additional labor market job creation. The unemployment rate edged higher to 3.7% but still hovers near 50-year lows. The labor force participation rate remains little changed over the month and year at 62.9%.
Stronger than expected labor market figures undoubtedly safeguard the economy against a potential recession.
US Nonfarm Payroll vs Federal Target Rate
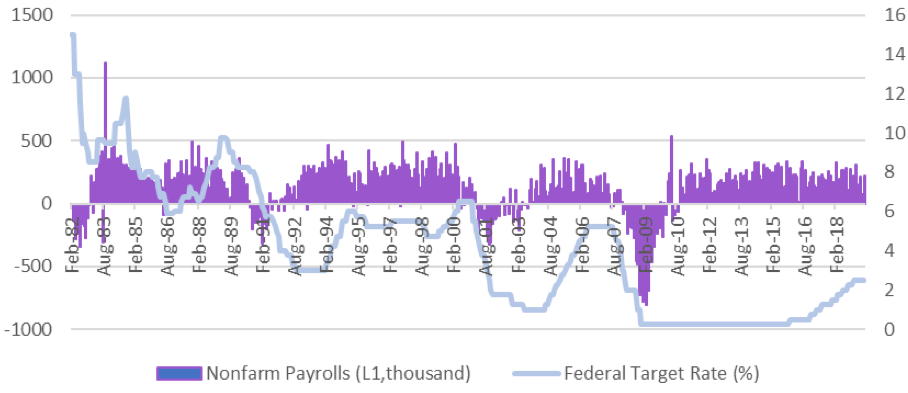
Source: Bloomberg
US Unemployment Rate vs Fed Target Rate
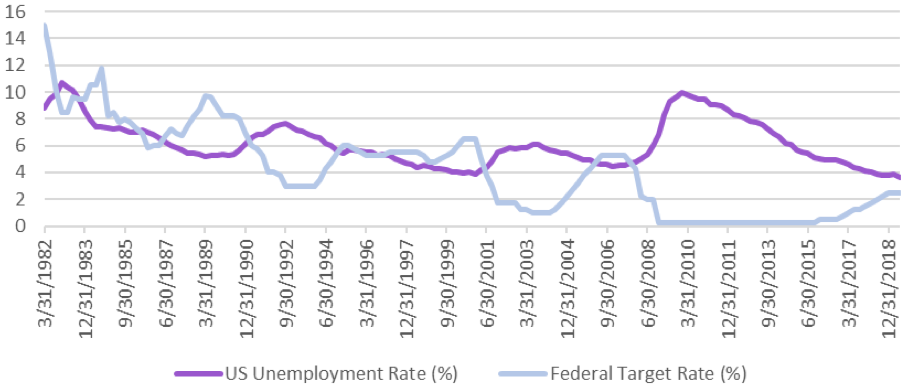
Source: Bloomberg
US manufacturing outperforms expectations
In addition to US labor market figures, ISM manufacturing PMI is another important indicator to watch. By examining the correlation of the PMI to the Fed’s rate decision cycles, we can deduce that rate cuts always begin when PMI is in a period of continuous decline. As shown below, at the time of the second and third rate cut, PMI had dropped below 50, indicating economic contraction. We are currently experiencing a June PMI of 51.7, surpassing the benchmark of 50 despite facing slowing economic growth.
US Manufacturing PMI vs Federal Target Rate
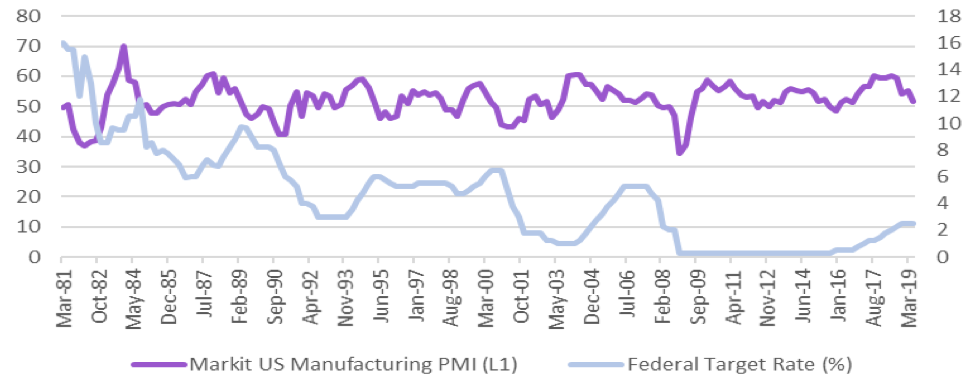
Source: Bloomberg
Strong labor market numbers combined with acceptable PMI metrics imply that it is still too early to fear a recession, despite current economic cooling. We believe the Fed will cut rates but are not bullish on additional aggressive monetary policy changes in 2019. As the Fed relies on economic data for the basis of policy decisions, we will continue to watch key economic indicators closely while preparing for increased forthcoming economic volatility.
How will asset prices react to potential rate cuts?
Our analysis of the data above indicates that rate cuts are not needed, rather intended to ease market worries about future economic slowdown.
If rate cuts are around the corner, how will asset prices react?
US historical data shows that different asset classes have elicited different reactions to rate cuts. For example, equities tumbled during the internet bubble and subprime mortgage crisis; however, during times of stronger labor markets (i.e. 1984 and 1989), equities performed relatively better while US Treasuries dropped. In short, expansionary monetary policy has generally positively impacted bond markets at the expense of increased systemic volatility that affects all asset classes – particularly during periods of financial crisis.
Performance by Asset Class During Rate Cuts
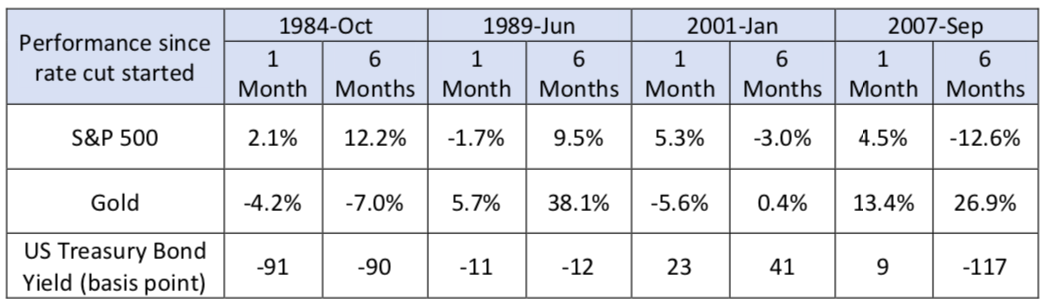
Source: Bloomberg, FinEX Asia Investment Ltd
How will consumer credit react to potential rate cuts?
In our research article “A Patient Federal Reserve and US Consumer Credit Outlook,”we discussed the low correlation between US consumer credit and mainstream asset classes. While credit card interest rates move with Fed Fund Rates, credit margins remain insensitive to rate movements. In times of rate cuts, the downward slope of the Fed Fund Rate curve is much steeper than that of interest rates.
Consumer credit performance is much more responsive to labor market strength and credit margins have a significant buffer built into them to safeguard lenders during periods of economic uncertainty. Poignantly, even during recessions when consumer loan charge-off rates spike, the basis between credit card interest rates and charge-offs has historically remained positive.
As a result, it can be concluded that the volatility of consumer credit is much more stable than that of other traditional investment instruments. As shown in the table below, the FinEX Asia Marketplace Fund, which invests in consumer credit sourced from leading US marketplace lending platforms, has realized lower than 0.5% volatility while the S&P 500 battles levels approaching 15%.
Volatility Comparison Among Asset Classes
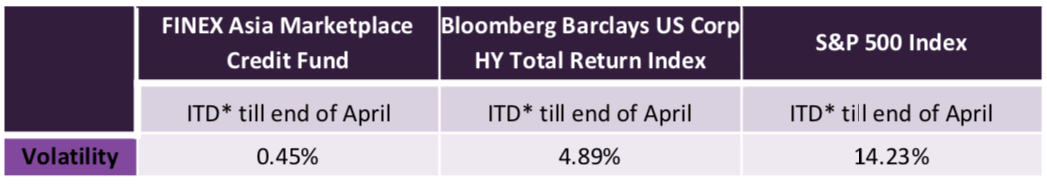
* Since October 2017
Source: Bloomberg, FinEX Asia Investment Ltd
US Credit Card Interest Rate, Charge-off Rate and Fed Fund Rate (Upper Band) (%)
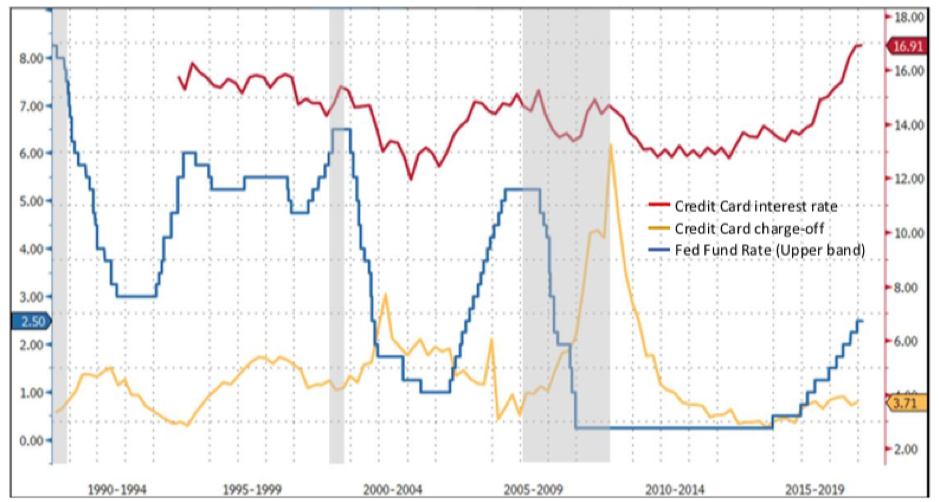
Sources: Bloomberg
We see a higher correlation between credit card charge-off rates and US unemployment rates than that between charge-off rates and the Fed Fund Rate. As recent US unemployment figures and average hourly wages remain strong, we have not identified any potential inflection points and continue to be bullish in our short-term assessment of charge-off rates. Furthermore, rate cuts would have a limited impact on consumer credit as long as the economy fights off systemic crisis, like the Great Recession in 2008.
In other words, the Fed Fund Rate may impact the nominal interest rates of consumer credit but its profit margins will remain unaffected.
US Unemployment Ratevs USCredit Card Charge-off
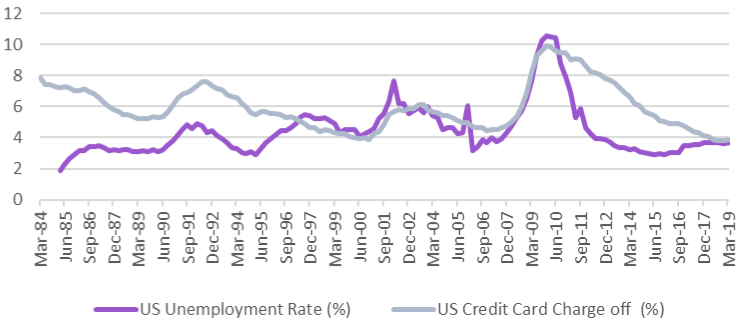
Source: Bloomberg
While quantitative easing has historically been rarely used for preventative measures, it is increasingly becoming the new norm. However, this could be emblematic of flaring financial markets. This new trend in economic measures could artificially pump up asset prices and derail market pricing from real economic growth, thus opening the door for significant future volatility. Furthermore, it devalues cash while investors, though profiting short-term from rate cuts, could potentially face unforeseeable risk and high market volatility.
While 87% of assets recorded losses in 2018, nearly all investments have experienced positive gains in the first half of 2019. While touted as a period of financial recovery, this golden period for investment gains should serve as an indicator for concern. Could this be the calm before the storm?
